This lab is intended to introduce students to the data and graphs associated with non-uniform acceleration. In preparing this lab, I have assumed that students have prior knowledge regarding collecting motion data, analyzing distance vs. time; velocity vs. time and acceleration vs. t graphs. The primary goal of this lab is to show students the difference between uniform and non-uniform acceleration but it also includes a very basic introduction to the integration of a vs. t graph.
Non-uniform Acceleration Lab
Purpose
In this lab you will analyze the motion of a cart that is attached to a chain hanging from a pulley.
Procedure
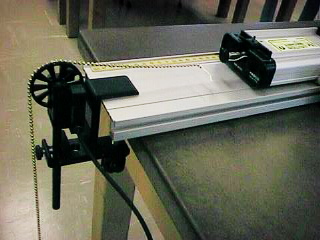
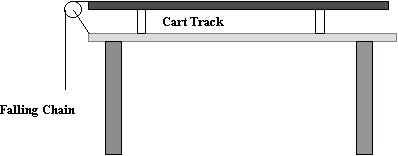
- Set up the apparatus as illustrated above. Attach the chain to the dynamics cart and position the chain over the smart pulley so that the smart pulley rotates as the chain falls.
- Launch the Logger Pro program and install the smart pulley into the appropriate digital input. Have Logger Pro graph distance vs. time, velocity vs. time and acceleration vs. time. In addition, create a calculated column for total time.
- Position the chain over the pulley so that the cart begins to move on its own.
- Once the cart begins to move, begin recording data and stop as soon as the cart crashes into the pulley or the chain hits the floor.
- Examine your data and determine what parts of your data coincide with the final crash and any interference at the beginning. Delete this data from your table by using the strike data cells option under Edit. Re-scale the graphs. (You may want help deciding what data to keep or delete)
Pre-Lab Questions
- What do you expect the graph of distance vs. time to look like?
- What do you expect the graph of velocity vs. time to look like?
- What do you expect the graph of acceleration vs. time to look like?
- Use the graph below to determine the distance traveled between 2 and 5 seconds.
Data
Either print or copy into table form the following table that should be on your screen.
|
|
|
|
|
|
|
. |
. |
. |
. |
. |
|
. |
. |
. |
. |
. |
|
. |
. |
. |
. |
. |
|
. |
. |
. |
. |
. |
|
. |
. |
. |
. |
. |
|
. |
. |
. |
. |
. |
|
. |
. |
. |
. |
. |
Analysis
- Print a copy of your distance vs. time, velocity vs. time and acceleration vs. time graphs.
- Based on your prior knowledge, explain what is happening according to your distance vs. time graph.
- Compare your velocity vs. time graph with the velocity vs. time graph you obtained from a cart traveling down an incline. How do these 2 graphs compare? Are they similar? Are they different? How are they different?
- Compare your distance vs. time graph with the distance vs. time graph you obtained from a cart traveling down an incline. How do these 2 graphs compare? Are they similar? Are they different? How are they different?
- Determine the distance traveled by the cart by calculating the area under the velocity vs. time graph as you did in the previous lab.
- Contained in the Science Workshop program, under the statistics function, is a tool called integration. Integrate the velocity vs. time graph and compare this number with the total distance traveled during the same time frame as determined from the distance vs. time graph. What do you notice about the integral of velocity vs. time and distance traveled?
Post Lab Questions
- If you integrate something, what are you really doing?
- Can you tell if an object is accelerating at a uniform or non-uniform rate from looking at the shape of a distance vs. time graph?
- Can you tell if an object is accelerating at a uniform or non-uniform rate from looking at the shape of a velocity vs. time graph?
- Can you derive an algebraic equation to calculate variables for a non-uniform accelerating object?
Non-uniform Acceleration Lab: Teacher's Section
Lab Apparatus
The source of the non-uniform acceleration is a chain (the type you attach to lamps or ceiling fans). I imagine you could use other things so long as it causes an non-uniform force. This chain is attached to a dynamics cart (pasco variety) but you could also use other cars with or without track. The chain is carefully positioned into the groove of the smart pulley and attached with simple string to the cart. You could use a different pulley mechanism and substitute a motion detector for the smart pulley, but I thought the smart pulley interface was the most simple. You set up the chain so that there is enough chain over the pulley to begin pulling the cart. As more of the chain begins to fall, more force is being applied to the cart while less mass is being pulled. This creates a non-uniform force acting on the cart, which results in a non-uniform acceleration. Ideally, you want to begin taking data as soon as the cart begins to move and you want to stop collecting data as soon as the cart hits the pulley or the chain hits the floor. Your data at the very beginning and at the end may be erroneous so I suggest you use the software to delete this data.
The set-up above uses a smart pulley to measure linear position and time, from which velocity and acceleration can be calculated. (You can also measure jerk if you want to introduce the 3rd derivative of a distance vs. time graph)
What should the data and graph look like?
A.J. Lychy
Updated 1/13/05